Overview
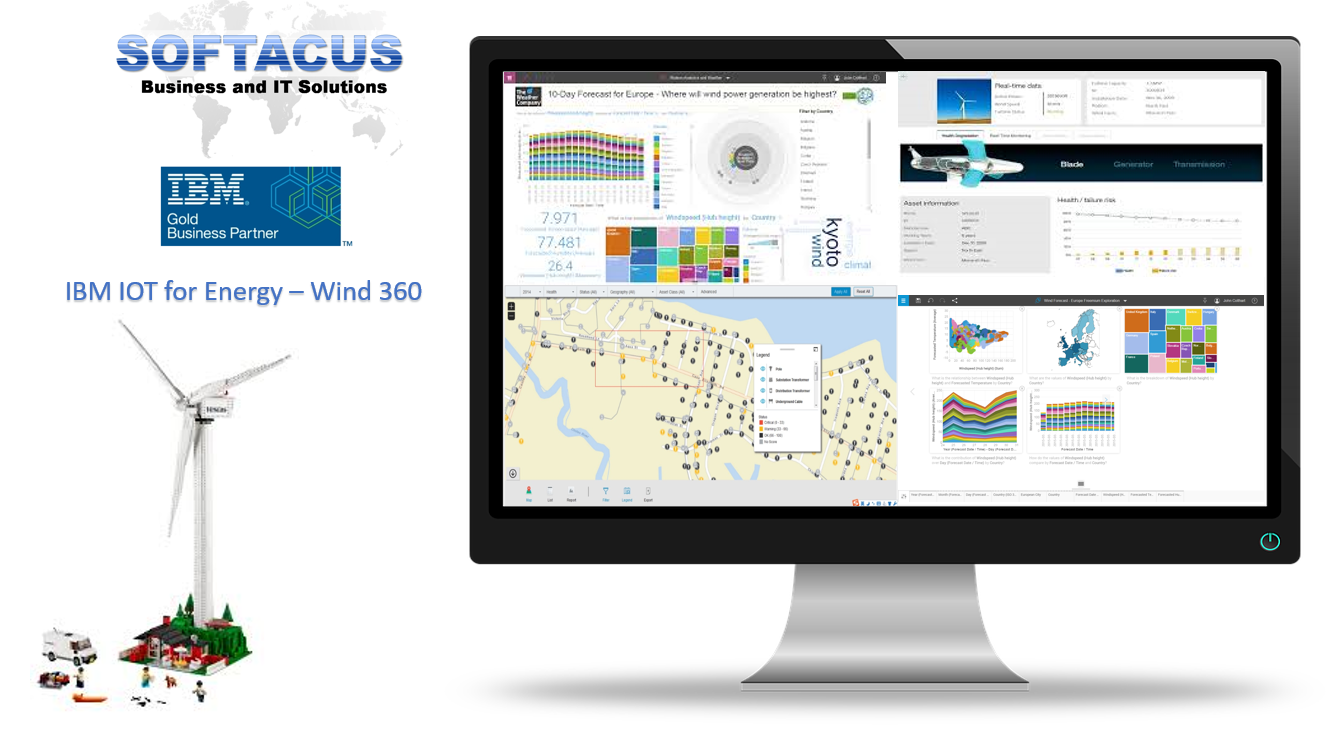
The IBM Insights Foundation for Energy WIND360 application provides an advisor for wind farm operations and maintenance.
The Wind 360 application integrates wind farm operational systems to deliver a business driven solution. The application leverages predictive, prescriptive, and cognitive solutions with mobile technology to improve wind farm operation and maintenance efficiency.
Insights Foundation for Energy uses widgets from The Weather Company. You need to subscribe to the IBM Insights for Weather to receive data for use with these widgets.
You must clean and generate static data from the IBM Foundation for Energy Wind 360 application before you can generate real time data.
The real-time data is used to model in real time sensor data.
The Wind 360 application for IBM Foundation for Energy has dashboards that have differing access rights dependent on the user profile.
Viewing and analyzing energy data
Use IBM® Insights Foundation for Energy to analyze the health and risks to the network grid.
IBM Insights Foundation for Energy is a web-based solution that uses portal technology. You can access the solution with any supported web browser.
Assets can be viewed on a geospatial map or as a list. The displayed assets can be filtered using criteria specified by the user.
Detailed reports can be displayed for individual assets, or groups of assets.
The User Interface
The application user interface is composed of four parts:
- Filter bar - to filter assets for different criteria, e.g. status, asset class, geography.
- Task bar - to show or hide the filter bar, legend panel, or switch between the content to map, list or report view.
- Content area - to visualize differing approaches of assets, including map, list, and report views.
- Legend panel - to show the different asset classes and the score ranges the representative colors.
Figure 1. User interface
Log on to access the IBM Insights Foundation for Energy user interface.
The task bar contains the controls for how the various panels and filter options show in user interface.
The filter bar contains the controls to filter assets for different criteria, e.g. status, asset class, geography.
Assets and their connections within the energy network can be seen on a geographic map. Depending on the zoom level, either individual assets and their health, or an aggregation of assets and the health of the combined assets are displayed.
Assets and their network health and risk values can be displayed as a list.
The assets displayed on the map or list can be filtered based on selected criteria.
The Connectivity Model gives feedback to managers, data analysts and grid operators as to the accuracy of the phase and connectivity details of the network.
You can view detailed reports on a single asset or on a group of assets.
The IBM Insights Foundation for Energy WIND360 application provides an advisor for wind farm operations and maintenance.
After filtering the data to the desired subset, information on the selected assets can be exported for use in other systems.
Using IBM Insights Foundation for Energy, regional planning engineers determine where investment is required to maintain or improve reliability.
The Wind 360 application for IBM Foundation for Energy has dashboards that have differing access rights dependent on the user profile.
Deputy manager - KPI Dashboard
The key performance indicator dashboard consists of reports that keep the user aware of the current performance of the wind farm without requesting further information. After logging in, the user with KPI Dashboard privileges can view the KPI dashboard and see an overall view of the performance of the wind farm.
Farm KPI report
The KPI report dashboard shows the overall operation index of the wind farm. The index is developed from four dimensions: power production, turbine availability, wind power conversion rate and turbine health. The deputy manager can also see the overall ranking among similar wind farms. The color of the scores represents different ranges: red: <60, yellow: 60-80, green: >=80.
Power Generation report
The Power Generation report shows the power production in MW, loss due to down time in MW and the total lost time compared over a three week period, the previous complete two weeks and current week.
MTBF and MTBR report
MTBF - Mean Time Between Failure
MTTR - Mean Time To Restore
The MTBF and MTBR report shows the comparison between MTBF and MTTR over the previous eight months. The time period can be altered.
Maintenance Cost report
The Maintenance Cost report compares the cost of maintenance of the turbines over the same time period of this year and last year on a monthly basis. You can use the calendar to choose the time period you want to view.
Utilization Hours report
The Utilization Hours report shows the power generated, loss time and utilization hours during the period of time selected from the calendar.
Utilization hour = power generation / turbine full capacity. The Utilization Hours report is the most important KPI for a wind farm.
Weather Forecast report
The Weather Forecast report, shows the weather information such as temperature, wind speed, wind direction, and humidity. You are also provided with maintenance suggestions according to the weather condition. The wind speed shows also for the next 12 hours.
All the weather data is from The Weather Company API.
Operational Engineer - Monitoring dashboard
The operational engineer is responsible for individual turbine and overall farm monitoring. The engineer needs to know the current state of each turbine within the wind farm.
The Map and list views
The Map view shows a visualization of data items associated with their relevant positions on the map. Using the information displayed on the map together with the list view, you can identify location patterns. A score for each turbine indicates the working effectiveness of each turbine.
You can view the basic information for each turbine by hovering over the icon representing the turbine. The hover card shows the turbine serial number, working status, index score, and wind speed. The icon color is consistent with the legend color.
Wind Speed and Direction Trend report
The Wind Speed and Direction Trend report shows the wind condition for the farm. You can hover on it to see the condition for a specific day. The deep blue part of the report represents the past, and the light blue part represents the forecast for the future days.
Farm report
The Farm report shows the three reports:
- Power generation report
- Utilization Hours report
- Turbine Availability report
Turbine report
The Turbine report shows three reports for an individual turbine:
- Turbine KPI report shows the overall operation index for a single turbine. The index is developed from four dimensions: power production, turbine availability, wind power convention rate and turbine health. The color of the scores represents different ranges: red: <60; yellow: 60-80, green: >=80.
- Power curve report shows the actual power curve of the wind turbine compared to the conceptual power curve. If the curves differ greatly, then the turbine is not operating in its optimum state.
- Utilization Hours report shows the utilization hours for a single wind turbine.
Turbine detail report
The Turbine detail report shows three reports:
- Turbine basic information shows the real-time data including active production, wind speed, communication state. The Turbine detail report also shows the turbine type, identification number, installation date, region of installation, wind farm information, and working wind speed.
- Health Degradation report shows the information for health / failure risk and asset details for the major components of the turbine, blade, generator, and transformer.
- Real-Time Monitoring shows 11 real time readings for: Wind Speed, Angle-Blade1, Angle-Blade2, Angle-Blade3, Power At, Turbine Speed, Vibration-X, Vibration-Y, Wind Direction, Yaw Speed, Yaw Wind Direction.
Deputy Manager - Maintenance Dashboard
The Maintenance Dashboard for the Wind360 application gives the user an automatic and optimized maintenance plan that takes into consideration differing constraints and goals. The user can review the plan. The user can also action to generate work orders for different maintenance engineers.
The KPI Dashboard contains the reports that give an overall view of the performance of the wind farm.
The monitoring dashboard shows the operational information for the current sta e of the wind farm
Softacus Services
We, in Softacus, are experts when it comes to consulting and service delivery of IBM software products and solutions in your business. We help our clients to improve visibility and transparency when licensing and managing commercial software, providing measurable value while increasing efficiency and accountability and we are providing services in different areas (see Softacus Services).
IBM ELM extensions developed by Softacus are free of charge for the customers who ordered IBM ELM licenses via Softacus or for the customers who ordered any of our services. If you are interested in any of our IBM ELM extensions, you found a bug or you have any enhancement request, please let us know at info@softacus.com.
Related and Referenced Topics
Blog Articles:
Basics of Links and Link Types in IBM DOORS Next Generation - learn the basics about the linking and link types in IBM DOORS Next.
Linking Techniques in IBM DOORS Next - article explaining basic concepts and showing multiple ways of creation of links between artifacts.
Link By Attribute Feature in IBM DOORS Next - the article explains how to use the "Link by attribute" function to automatically create, update, or delete one or more links between artifacts based on values in the attributes of the artifact.
Softacus Widgets:
Link Switcher - widget developed by Softacus, that converts the context of artifacts links in a very short time.
Module Link Statistics - extension that provides users with a quick overview of the amount of the links in specific link types in a module.
Link Type Change- extension developed by Softacus designed to enhance the functionality of DOORS Next Generation by allowing users to manipulate the direction of a link or convert it to another type of link.
Links Builder- extension that allows the users to create a link between two artifacts in DOORS Next Generation according to the certain rules.
Link by Foreign Attribute - this extension allows users to create links between artifacts in the selected module(s), based on the attributes values.
Show Attributes of Linked Artifacts - this extension shows the attributes and links of the artifact that is currently selected.